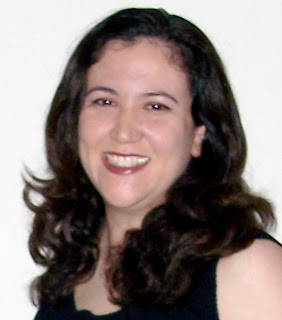
Hi, I'm Christina

I had a great time at NIWeek 2009! It was so cool to meet with NI customers and see the amazing things they accomplish with our products.
One thing that surprised me is how many people were curious about me, the person who writes Eyes on VIs.
So I thought it would be good to take a moment to introduce myself.
Q: Who are you?
A: I'm Christina Rogers, a senior software engineer in the LabVIEW R&D group at National Instruments.
Q: What do you do?
A: Part of my job is that I'm a proponent of usability and user interface design. I help other developers design the UI for their features, including dialogs and such. I also implement LabVIEW features, both in C++ and in LabVIEW VIs (a.k.a. G).
Q: What kinds of things have you worked on?
A: I've been on the LabVIEW team for 12 years, so I've worked on all kinds of things, including the Getting Started window, the Navigation window, report generation, printing, the multicolumn listbox, type definitions, and other things I'm probably forgetting at the moment.
Q: And the "Eyes on VIs" blog?
A: I started this blog as a way to share my LabVIEW knowledge directly with LabVIEW users.
Q: Is it part of your job?
A: No. Although folks at NI appreciate that I run this blog, it's not what they pay me for.
Q: Who else works on "Eyes on VIs?"
A: Just me. I write the content, make the videos, do the graphics, do the web development, etc. Well, except for that time I had Norm as a guest blogger.
If you have any other questions, please feel free to leave me a comment!

5 Comments:
Could we have a step size in the for loop?
Hi Christina,
Yes, this blog is very interesting. I have it in my RSS reader and I always enjoy learning about your tips and tricks! I specially enjoyed the icon editor and the customization posts!
Thank you
Anonymous - NI has a new way to request LabVIEW features at ni.com/ideas. Please post your request there so that everyone can discuss the details and vote for the idea.
Olivier - I'm so glad you find my posts useful! Thanks for reading and for the comment here. :-)
You said: "Part of my job is that I'm a proponent of usability and user interface design". I want to make a suggestion regarding labeling of the time axis on graphs. I hope you will see how it will improve graphs and will therefore be an advocate for it. I've made it several times before via the official NI channels, but it has never been done.
Suggestion: make the labeling of the start and end points on the axes user configurable. Many times the labels are not opposite a major tic mark and they eclipse nearby marks that should be shown opposite the major tic mark. This is especially bothersome on the horizontal axis when time labels are being placed.
For a live trend plot, I would like both axes labels to scroll, or move, and to look like a section of a yardstick that has be cut (at a location that is not necessarily a major tic mark). As the time axis scrolls, the starting and ending times may or may not be labeled. Only major tic marks deserve to be labeled.
Lewis,
I agree that LabVIEW graphs should have this ability. Please consider adding it to ni.com/ideas. Your request is much more likely to get staffing if it comes in through that channel, because other customers can lend their support.
- Christina
Post a Comment
<< Home